Quantifying Opportunity Costs for Advisors
MAKING THE INTANGIBLE, TANGIBLE
The cost of inaction is a tricky thing to put your finger on. We know it is all around us in our everyday lives, yet it is intangible. For advisors it can be not approaching a wealthy prospect for fear of rejection or executing the right marketing to attract new clients.
However, the cost of inaction in volatile times can be painfully tangible. During the COVID19 crisis, advisors have been on DEFCON 4 with both nervous clients adjusting portfolios to mitigate losses and value investors strategizing on excess cash deployment and mispriced securities.
In either case, the real opportunity costs lie with the advisor and how wisely he or she manages trading activity. The cost of inaction for advisors is defined as the time between when an order is placed and when the order is executed. The longer that time of inaction persists, the bigger the opportunity cost!
IDENTIFYING OPPORTUNITY COSTS
The key is that advisors must be able to react to the market in near real time to maximize portfolio value. The days of creating and downloading order files, uploading them, and waiting around to submit them to be filled is long gone. We’ve all seen how that movie plays out, especially the tragic ending when the market moved against the advisor resulting in a far worse price than they expected when the order was placed (cue the violins).
The stark implications of not efficiently managing transaction costs are severe and should be priority number one in your practice management strategy:
• Misallocation of funds
• Inefficient stock selection
• Subpar portfolio construction
• Inappropriate implementation strategies
• Overall poor/lagging performance
MEASURING OPPORTUNITY COST
Most market participants are all too familiar with transaction costs like commission, fees, taxes and spreads. However, many are not as familiar with investment delay, price appreciation, market impact, timing risk and opportunity cost [see Figure 1]
Figure 1:
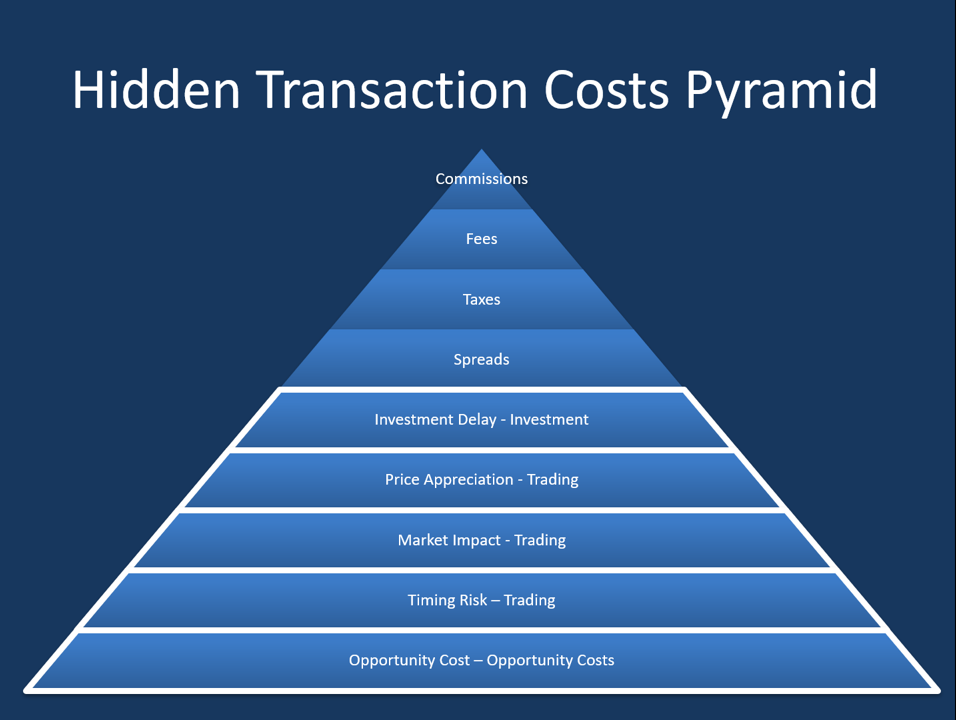
A quick look at the math shows an example of how a seemingly small increase in price from the time the trade was ordered to the time it was executed, results in a 50bps trading cost or $25,000.
Example:
Buy order 100k shares for ABC with a price of $50/share at the investment decision, average execution price was $50.25/share and all shares were executed.
TC ($) = 100k shares * $50.25 – 100k shares * $50.00 = $25k
TC (bp) = $25,000 / $5,000,000 * 104 = 50 bps
COST OF INACTION
Ensuring trades are ordered and placed as closely together as possible has no larger ramifications than during periods of high volatility where market impact can materially affect the price at which a trade is executed versus the investment decision price. Minimizing transaction costs hinges on the ability to get the trade done immediately so that the market doesn’t move against your investment decision.
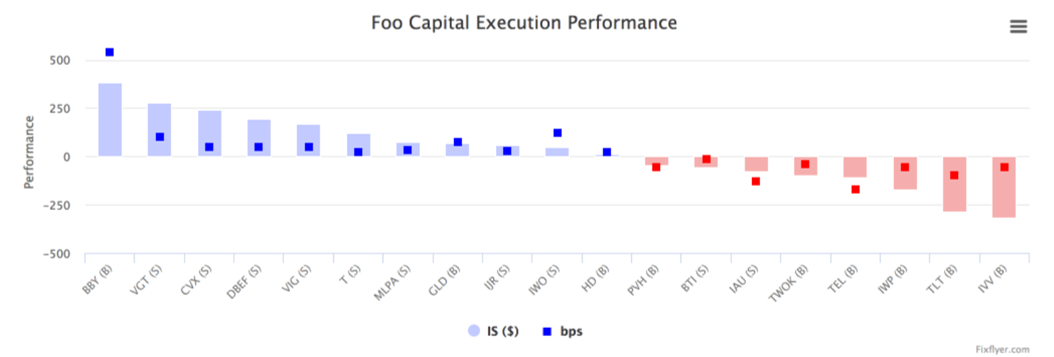
The following chart demonstrates a range of execution performance [Figure 2]. The ideal state is the HD (buy) order in the center, where the square dot and bar are aligned and flush with the Y axis, illustrating an extremely efficient trade at almost a zero basis point (bps) premium. While the advisor benefited from market movement on the BBY buy order, the advisor had a negative impact on the IVV buy order.
Figure 2:
BLOCK-BUSTER PERFORMANCE
Block trades are an effective way for advisors to aggregate individual investor orders into a single order to ensure investors receive the same average share price and to improve the advisor’s operational efficiency. However, block trades significantly increase the exposure to the transaction costs described above, such as market impact and price appreciation, as block trades exceed 10,000 shares or more.
An advisor may create a series of child orders and trade those orders manually over time to avoid market impact. This is a time-consuming and requires diligent tracking. Alternatively, the advisor may use trading algorithms (TWAP, VWAP) to automatically handle the creation and handling of child orders based on key parameters. Both approaches, manual and automated, are focused on avoiding an imbalance on the order book and managing execution price.
CARPE DIEM:
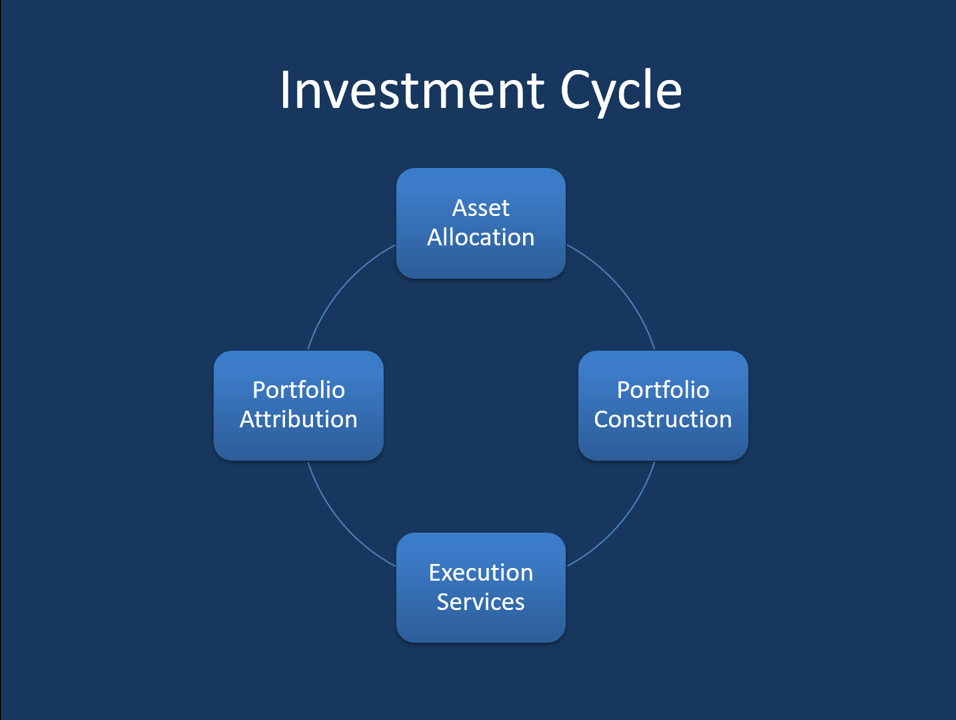
Opportunity cost impacts each step of the investment life cycle. Shoring up your trading infrastructure now will ensure you and your clients are reacting nimbly to market fluctuations and seizing opportunities when they are identified, not hours later. Electronic order routing that efficiently executes trades across multiple assets and counterparties, trading algos that reduce market impact, automating time-consuming middle and back office manual processes that contribute to investment delay, is available and in-market thanks to simple customized software and technology. Don’t continue subjecting yourself to the risky business of yesterday. Begin exercising good practice management by optimizing trading performance for your clients and your firm today.